install.packages('did2s')did2s
R package for 2-stage DiD estimator (Gardner 2021)
did2s is a package that implements the 2-stage DiD estimator proposed by Gardner (2021) that solves the bias of the TWFE in staggered settings. Documentation can be found here.
Install the package as follows:
sample code
Start by loading packages and the data:
library(did2s)
library(ggfixest)  # for plotting
library(readr)  # for importing data
df = read_csv('df.csv')
We use the did2s() function to run the did2s estimation for the ATT.
The first_stage = should contain all covariates and fixed effects. If no covariates, the formula should be ~ 0 | id + time. The second_stage = should only contain the treatment variable.
mod = did2s(
  data          = df,
  yname         = "outcome",
  first_stage   = ~ covar | id + time,  # if no covar, see above
  second_stage  = ~ i(treat),
  treatment     = "treat",
  cluster_var   = "id"                  # clustered se var
)
mod |> summary()
#> OLS estimation, Dep. Var.: outcome
#> Observations: 950
#> Standard-errors: Custom
#> Estimate Std. Error t value Pr(>|t|)
#> treat::0 -3.000000e-17 1.260000e-17 -2.38496 0.017276 *
#> treat::1 -1.091429e+00 4.763818e-01 -2.29108 0.022177 *
#> ---
#> Signif. codes: 0 '***' 0.001 '**' 0.01 '*' 0.05 '.' 0.1 ' ' 1
#> RMSE: 2.0478 Adj. R2: 0.04683The coefficient of treat::1 is our estimate of the ATT - the causal effect of treatment on those who receive the treatment.
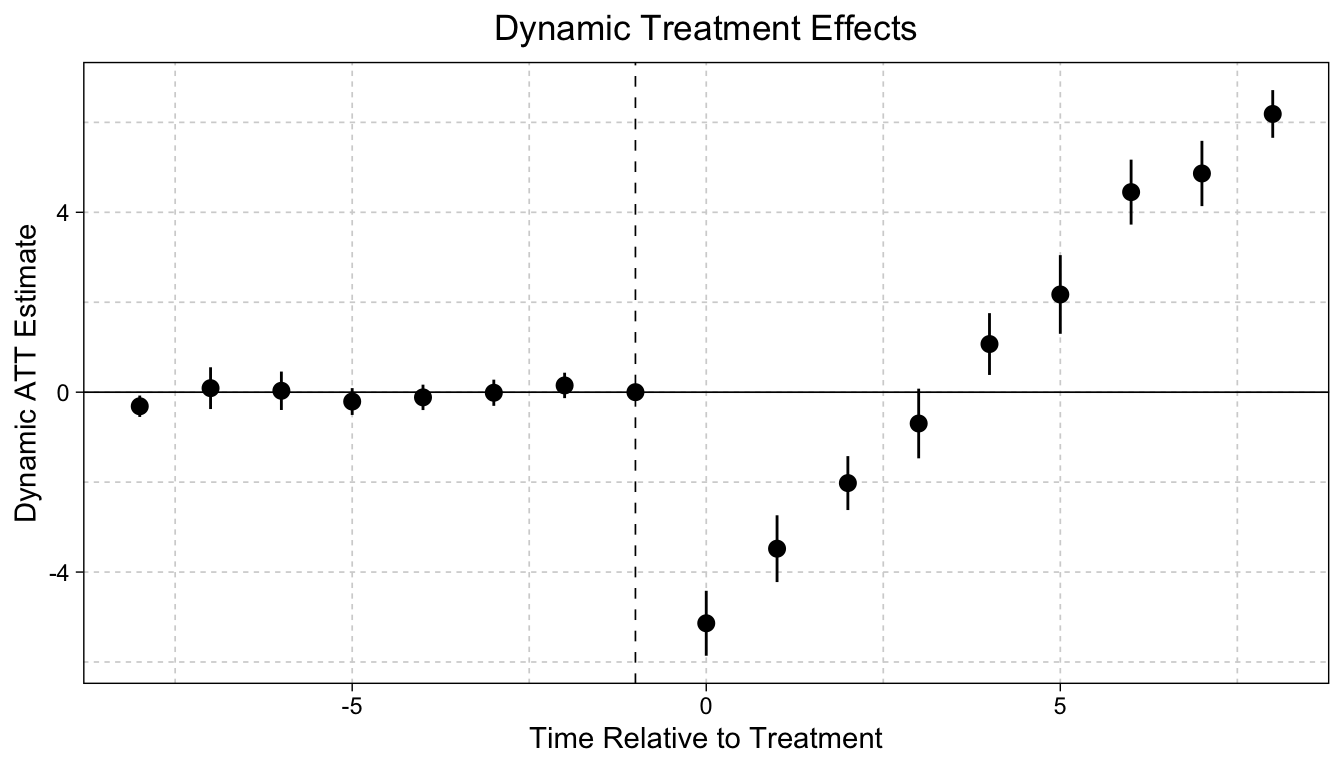
We still use the did2s() function to run the event study model, but we alter the second-stage of the model. We then use the ggiplot() function to plot our results.
mod = did2s(
  data          = df,
  yname         = "outcome",
  first_stage   = ~ covar | id + time,             # if no covar, see notes
  second_stage  = ~ i(rel.time, ref = -1),  # see notes for group
  treatment     = "treat",
  cluster_var   = "id"                             # clustered se
)

mod |> ggiplot(
  xlab    = "Time Relative to Treatment",  # x-axis label
  ylab    = "Dynamic ATT Estimate",        # y-axis label
  main    = "Dynamic Treatment Effects",   # title for plot
) +
  xlim(-8, 8) # select how many periods to display