install.packages('panelView')panelView
R package for DiD visualisations and panel analysis
panelView is a package that visualises treatment adoption and outcome variables for panel data. It is useful for understanding our data before beginning difference-in-differences analysis. Documentation can be found here.
Install the package as follows:
sample code
Start by loading the packages and the data:
library(panelView)
library(readr)  # for importing data
df = read_csv('df.csv')
We use the panelview() function to create a visualisation of treatment adoption.
panelview(
  data        = df,
  formula     = outcome ~ treat,
  type        = "treat",          # don't change - this is not the treat var, but an option
  index       = c("id", "time"),
  gridOff     = T,
  background  = "white",
  main        = "Status",         # title of plot
  xlab        = "Time Period",    # x-axis label
  ylab        = "Unit",           # y-axis label
  cex.axis.y  = 2                 # size of y-axis names
)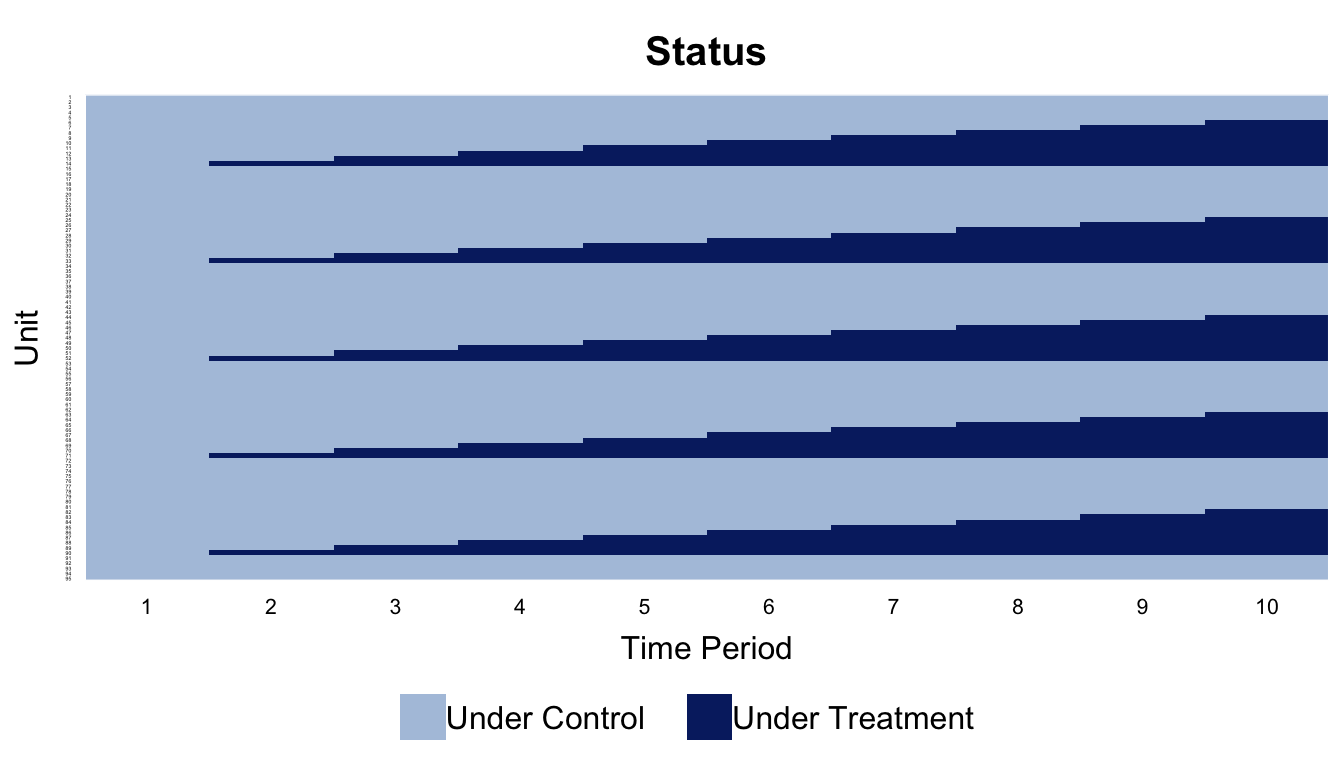
We can see here, that our treatment is staggered, with the first group receiving treatment in time period 2, and some units receiving treatment in every subsequent period.
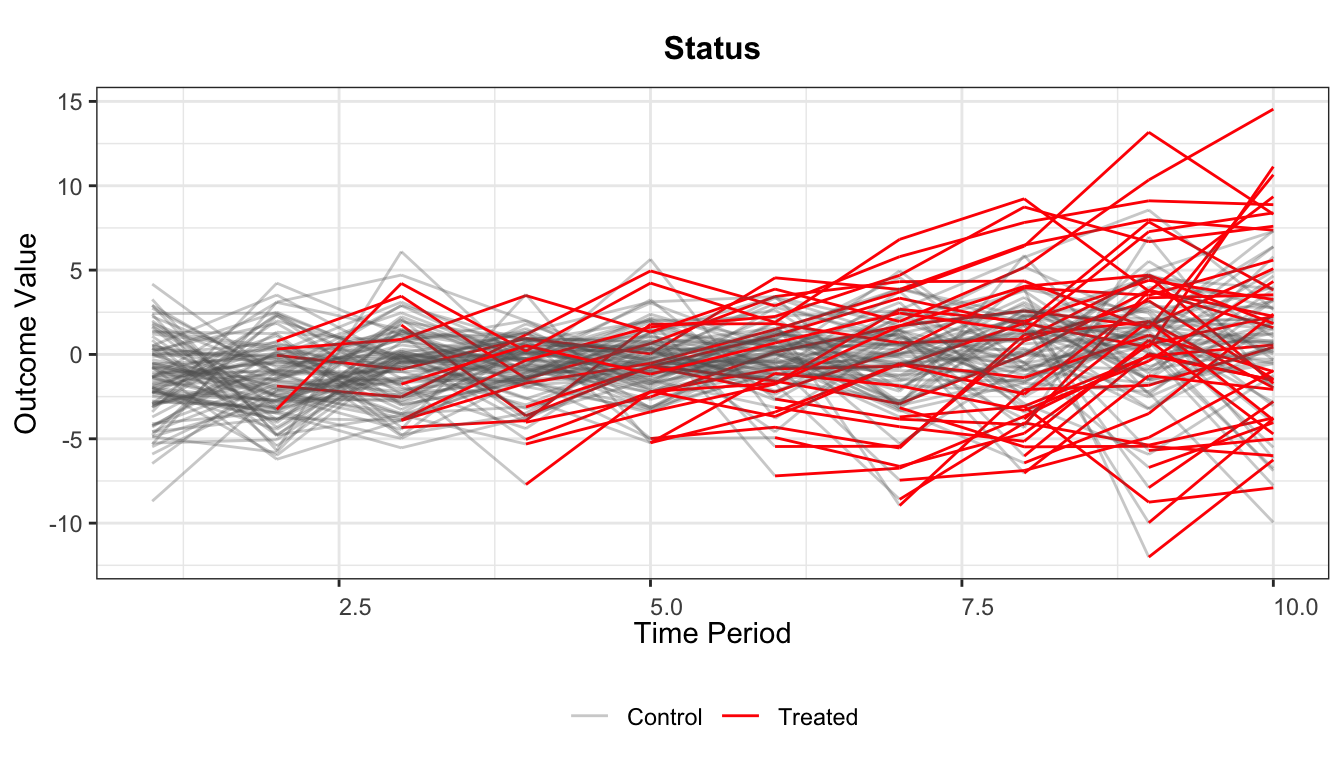
We also can use the panelview() function to visualise the outcome variable over time.
panelview(
  data          = df,
  formula       = outcome ~ treat,  # change to outcome ~ 1 to ignore treat colorcoding
  type          = "outcome",        # don't change, this is not a variable, but an option
  index         = c("id", "time"),
  pre.post      = F,                # you can try T and see which you like
  outcome.type  = "continuous",     # change to "discrete" if outcome is binary
  gridOff       = T,
  background    = "white",
  main          = "Status",         # title
  xlab          = "Time Period",    # x-axis label
  ylab          = "Outcome Value",  # y-axis label
  cex.axis.y    = 2                 # size of y-axis names
)